Devpost
Participate in our public hackathons
Devpost for Teams
Access your company's private hackathons
Grow your developer ecosystem and promote your platform
Drive innovation, collaboration, and retention within your organization
By use case
Blog
Insights into hackathon planning and participation
Customer stories
Inspiration from peers and other industry leaders
Planning guides
Best practices for planning online and in-person hackathons
Webinars & events
Upcoming events and on-demand recordings
Help desk
Common questions and support documentation
One Texas Team. Infinite Visualization Solutions.
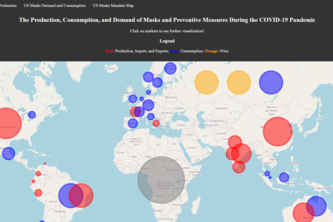
Hello, we are Team Mask. We created this visualization to help us better understand the impact of the COVID-19 pandemic on mask production, sales, demand, and behaviors.
Data visualization website combining two extensive datasets to explore trends in college data and mobility.
Displays the trends of mental health disorder occurrence and awareness.
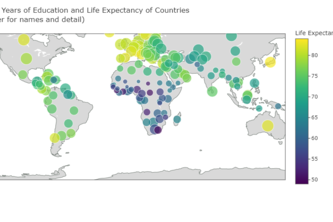
I decided to analyze three factors that differentiate the world’s disparities in living conditions: life expectancy, schooling, and the freedom to make life choices.
Two interactive dashboards showing global vaccination progress and COVID-19’s second-order impact on underreported communities, for achieving herd immunity and international health policymaking.
"Silenced but not invisible, visualizing Asian Americans across the country"
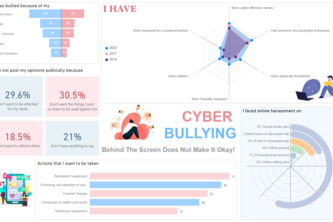
Cyber Bullying : Behind the screens does not make it okay! Stop Racial Discrimination: We unite together!
Cases, vaccinations and much more.... Track: Public Health
An interactive dashboard for analyzing police crimes and racial equity
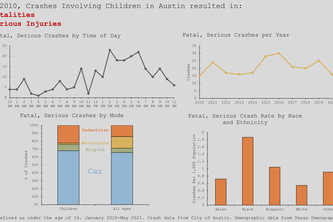
A series of visualizations on the trends in the data related to car crashes involving children in Austin, Texas.
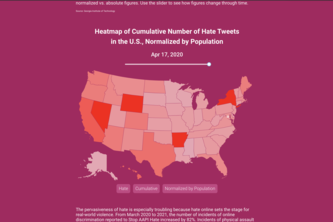
A study in the role of social media in society, reflected through the rise of anti-Asian hate and #StopAsianHate.
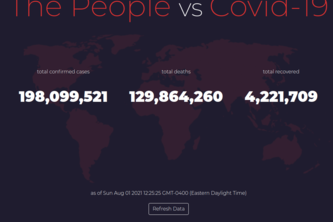
Interact with visualizations that document the history and current state of the Covid-19. Learn how you can "flatten the curve" to fight this pandemic.
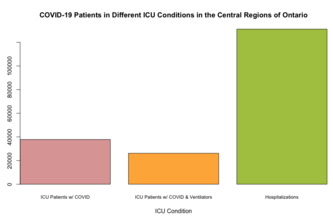
Welcome to my project on Ventilators and the Healthcare Crisis! It explores data from the CDC and the government of Ontario, RStudio, Tableau, and key findings from putting everything together!
Countries with high refugee population have higher human rights violations. In United Nation Human Rights Resolutions, will these nations stand against human rights violations increasing refugees?
Visualization of recession recoveries: Covid-19 and housing crisis
The Covid-19 X-ray Analyzer with a 97% accuracy can identify coronavirus with an Xray. Alongside it, we have done research on past pandemics and even chart COVID progression to understand the signs.
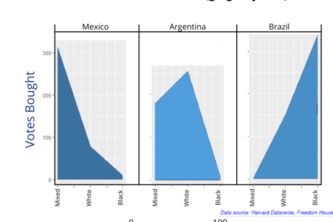
The failure of democracy from a global perspective, specifically regarding Latin America, the US, and European nations; attempting to visualize data regarding vote buying, democratic strength, etc.
Our project focuses on visualzing the trend and impacts of the COVID-19 pandemic, and build a vulnerability assessment framework.
Revolutionizing the Public Health Industry through Data Science.
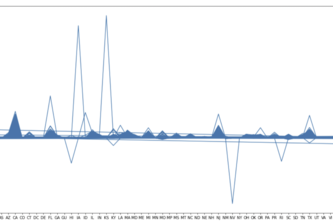
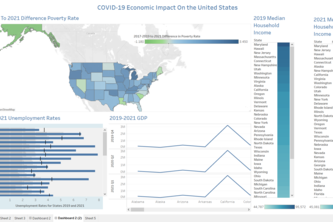
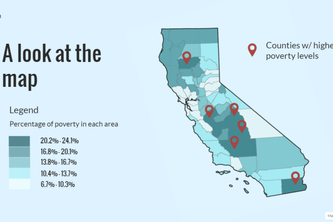
This project visualizes the economic impacts of the pandemic on a state-by-state basis in the United States. We analyzed poverty rates, state GDP, unemployment rates, and median household income.
SnapMap is a quick look of the accessibility of SNAP Benefits in California. It dives into the disproportionate ratio of the # of SNAP offices & how SNAP offices are often placed in white communities.
Providcy, analyzes COVID-19 policies in relation to protests from the US, Brazil, and South Korea.
Direct Effects of Race/Ethnicity by COVID-19
1 – 24 of 59